
Smart city labs
Welcome on this website. You will find several use cases developed by eLichens on its own technology to demonstrate
some of the possibilities made possible with this powerfull tool.
Several studies and performance analysis to offer you a better understanding of what is possible and how
the technology works.
This website is updated on a regular basis, so don't hesitate to visit it on a regular basis !

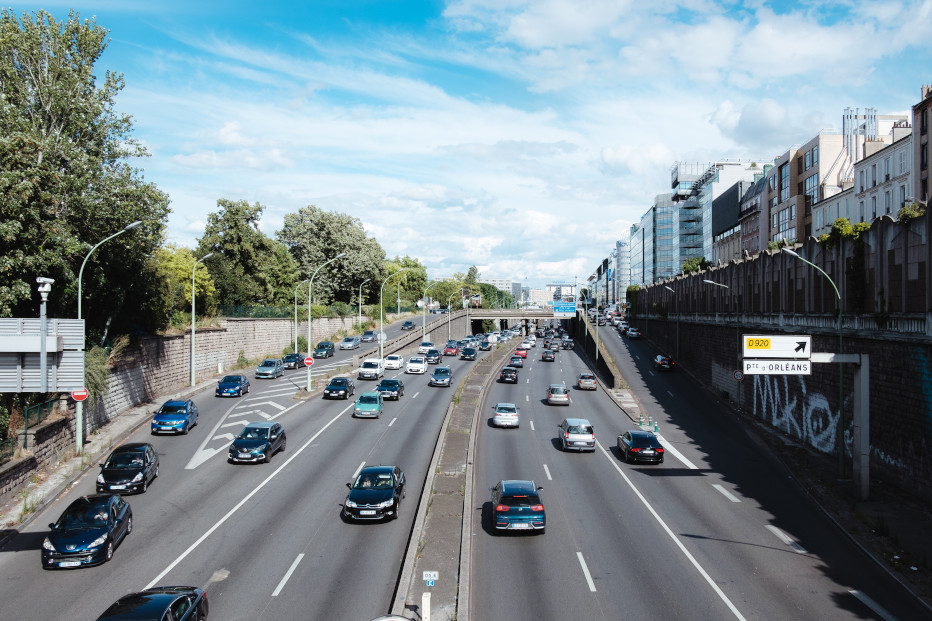
Paris' peripheral at 50km/h instead of 70 km/h ?
Paris' mayor Anne Hidalgo wants to reduce speed limit on Paris' peripheral from 70 km/h down to 50 km/h and encourage clean cars. What would be the impact on air pollution ?
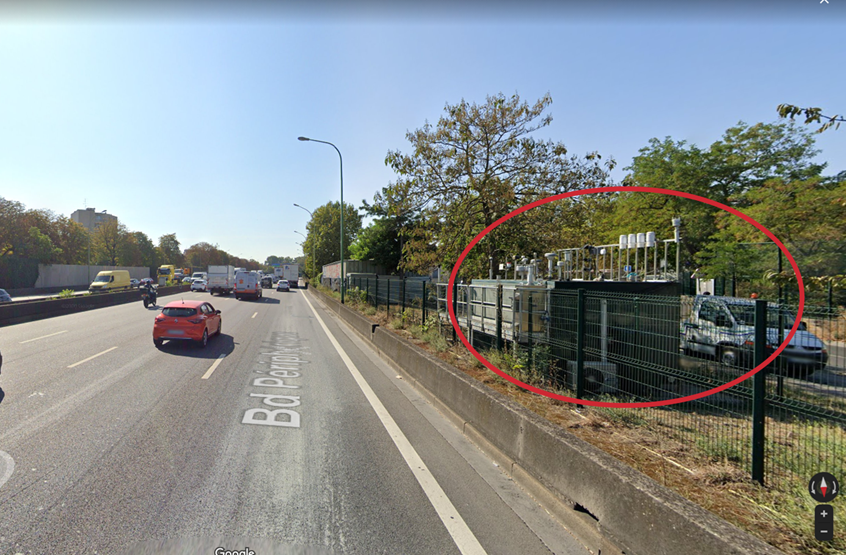
How public mobility policy impacts pollution level on Paris' peripheral ?
Discover a novel application of eLichens' technology !
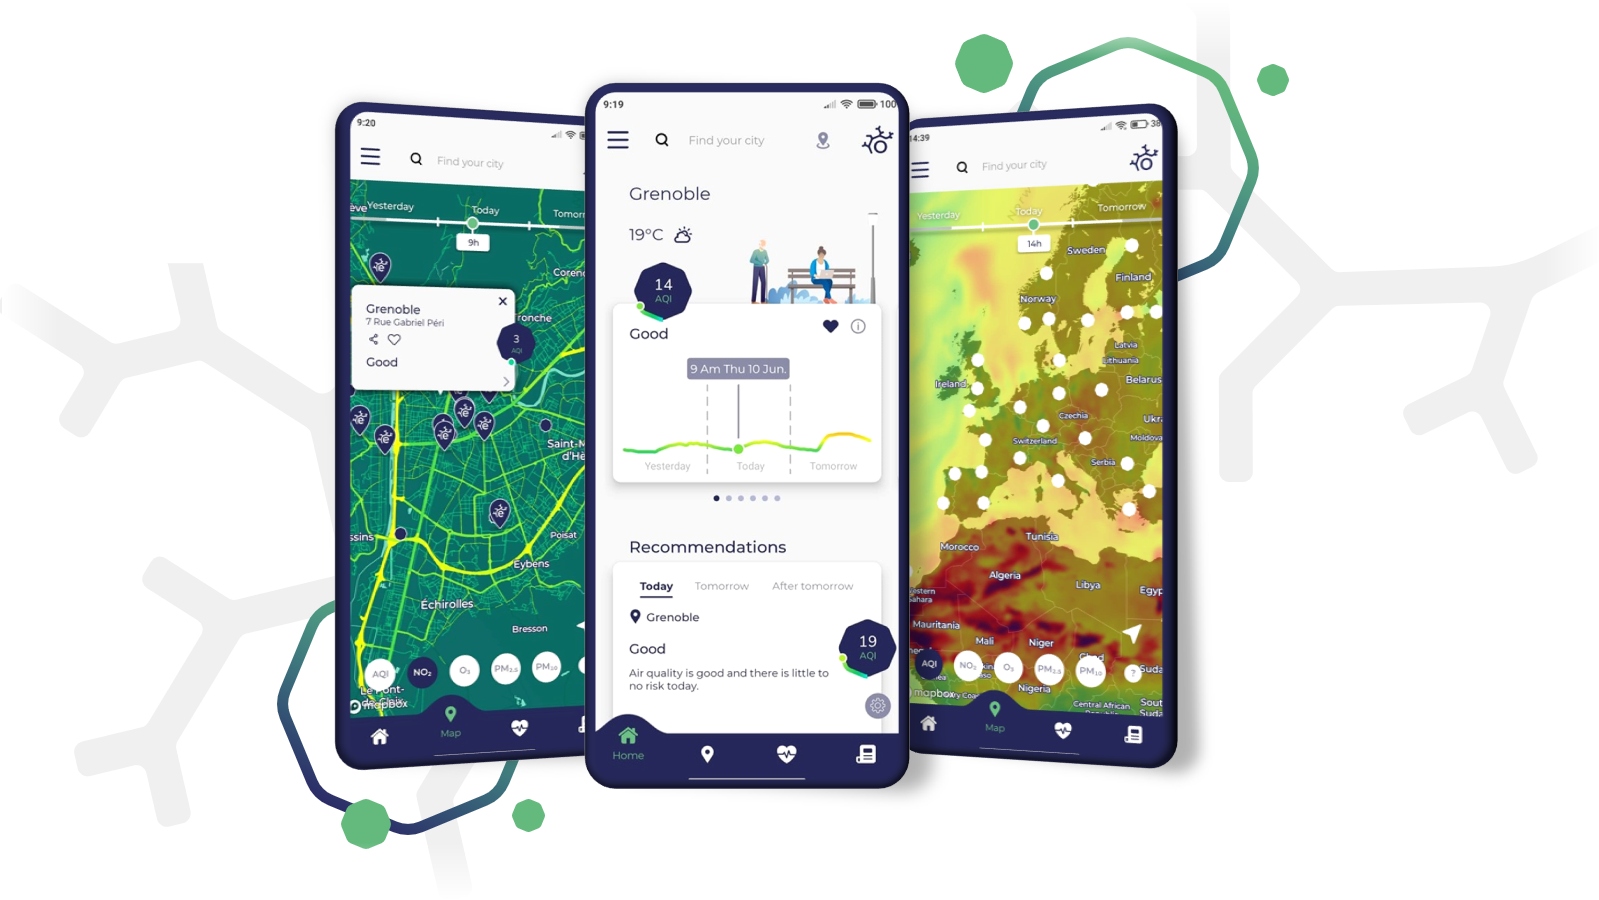
Discover eLichens Air
Discover eLichens' map technology through this super application.

How trafic impacts pollution level ?
Discover what would be pollution level in Grenoble without any trafic !
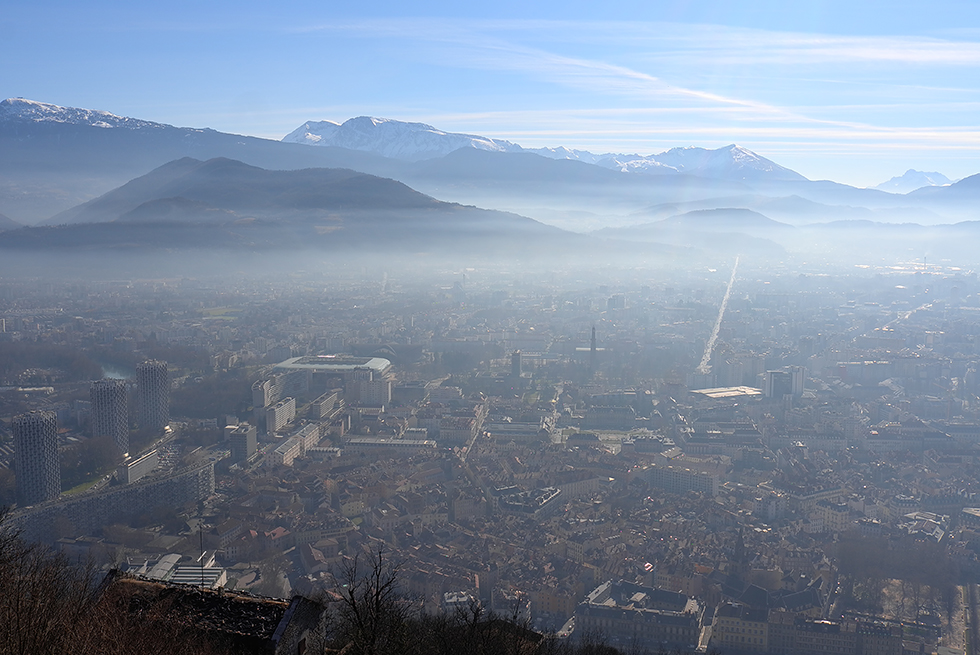
How buildings are exposed to pollutants in Grenoble ?
Discover an original map of Grenoble based on pollutant levels
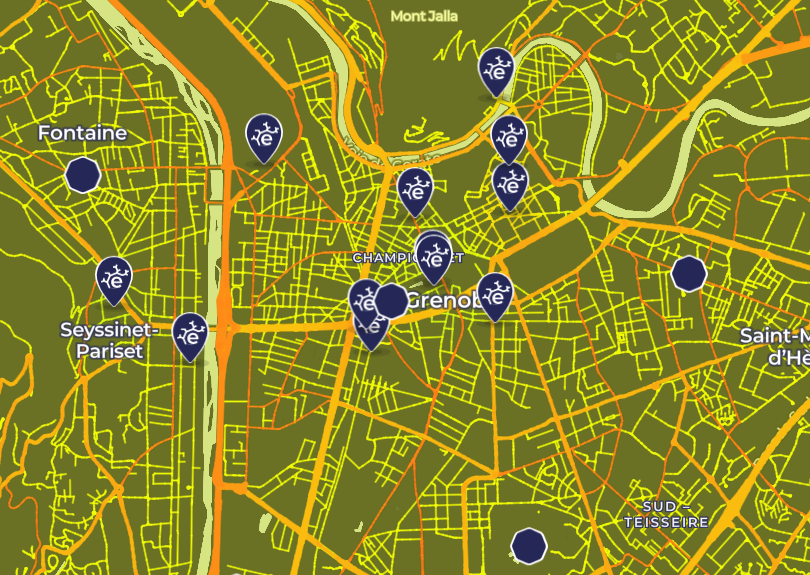
How data assimilation impacts pollution map in Grenoble?
Discover through a very simple visualization tool how data assimilation impacts pollution map in Grenoble.
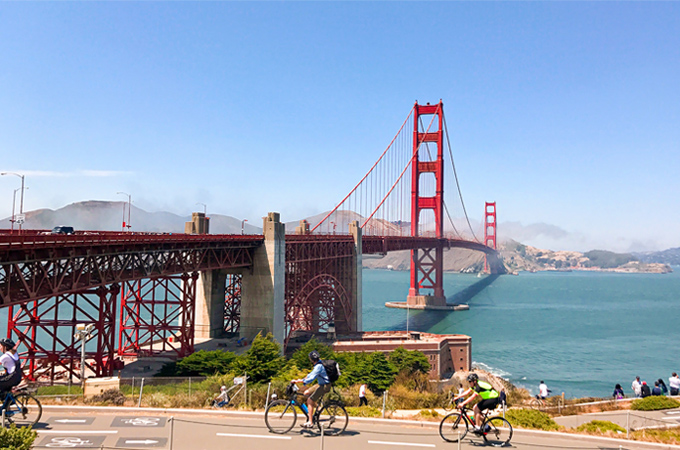
How to avoid pollution on your bike in San Francisco?
Same demo as Grenoble bike routing demo but in San Francisco
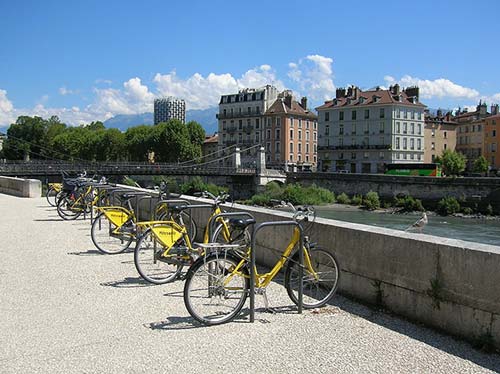
How to avoid pollution on your bike in Grenoble?
Find bike routes in Grenoble, measure your exposition to pollutants and visualize their levels on the way
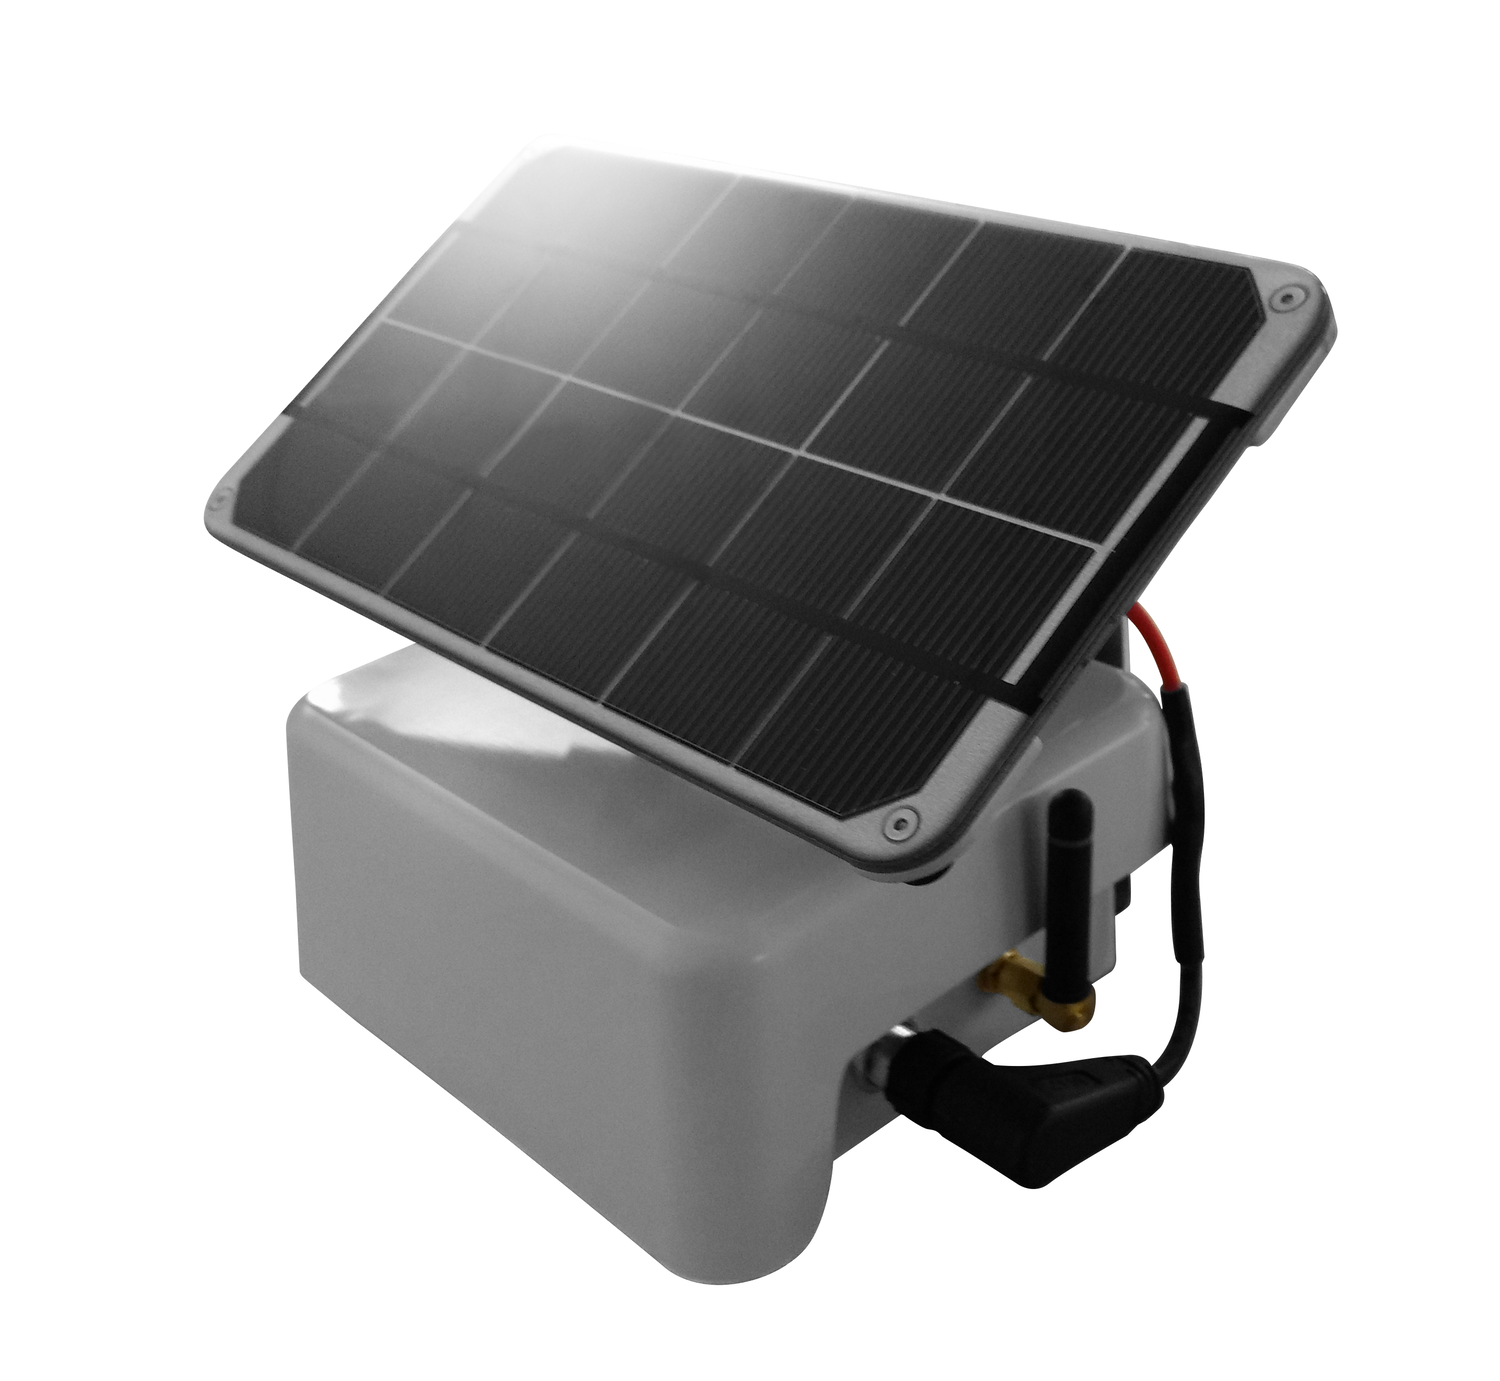
How to retrieve data from eLos ?
In this tutorial, we provide tools & examples to retrieve data from your eLos station.